
January 15, 2025
I want you to picture a home listing you’ve stared at long enough that you can already see your furniture in it. You’ve clicked through the photos twice. You’ve zoomed in on the furniture. You’ve zoomed in on the windows. You’ve checked the street view.
You’ve driven by both during the day as well as the night to see how the place looks. You’re doing the thing everybody does right before a big purchase. You’re building a life in your head. And then you scroll and you see a number you weren’t expecting. Flood risk, nine out of ten.
That’s it. Just a number. But suddenly, your whole mindset shifts and that kitchen isn’t only a kitchen anymore. It’s a place where you’re imagining water. The backyard isn’t a backyard anymore.
It’s in your imagination a flooded lake you don’t understand yet. The home stops feeling like a dream. So real estate purchases for a home are emotional in the best of times, but add this vision and your gut hurts. Or maybe you’re on the other side of the screen. Maybe you’re the seller.
And you’re thinking, nine out of ten? We’ve never flooded, not once, ever. Where did that come from? And why is it sitting on my listing like it’s a fact? Today, we’re talking about the score that can sink a home sale.
And the battle behind it who gets to rate a home’s exposure to natural disasters. How those ratings are made, and what happens when a forecasting model becomes market transforming. This is the resilience report. Hi. I’m Aaron.
Welcome back. This is the episode, the score that can sink a home sale. Episode five. Here’s the problem. Climate and disaster risk is becoming part of the home buying decision.
And where is that coming from? Well, insurance markets are forcing the issue. Extreme weather is forcing the issue, and data companies are forcing the issue. All by putting risk scores directly on home listings. But the scores aren’t perfect.
They can be blunt, They can be misunderstood. They can be wrong at an address level. And even when they’re directionally right, they could still shift buyer behavior fast enough to hit home values before anyone has agreed on the standards and how these listings work. Recent reporting from The Wall Street Journal described homeowners who believe high disaster scores And for this discussion, we are going to focus specifically on flood risk hurt their ability to sell, in some cases, leading to price cuts or homes sitting longer than expected. The journal also described disputes over accuracy and the difficulty of getting errors corrected.
That’s the spark for this episode. So how does the score get into the listing in the first place? For a long time, the core risk questions in real estate were handled indirectly. You get an inspection. You might check a flood map.
You’d get an insurance quote late in the process. The risk was there but it wasn’t always visible with a single mouse click. Then the real estate platform started experimenting with something different. Take complex climate and hazard modeling compress it into a simple rating, and put it right next to the photos. Zillow did this with climate risk information, sourced from a third party provider called First Street.
Zillow displayed numerical risk scores, flood, fire, heat, wind, air quality directly on the listing pages. And for consumers, I get the appeal of that simplicity. It’s fast. It’s comparable. And it feels somehow objective.
But that simplicity is also a trap. Because flood risk can mean multiple things, and not all of them correspond cleanly in terms of what a buyer thinks they’re reading. So what is a flood score, and what is it trying to measure? Let’s take one of the most widely used examples, First Street’s flood factor. Flood factor assigns properties a one to ten score based on cumulative flood risk over a thirty year mortgage horizon.
So it incorporates flood types like rainfall, rivers, streams, tides, storm surge, and uses these factors combined with elevation and your proximity to water, adaptation, and the flood history to estimate, all in all, the likelihood and the potential depth of a flood. That framing is very important. Cumulative risk over thirty years. Because a lot of people will read a high score like a near term prediction, It’s like saying, well, this home will flood soon. But a score built around cumulative exposure can be saying something more like, well, over the life of a typical mortgage, this location’s chance of seeing floodwater is meaningfully higher than other locations.
Even then, it still doesn’t automatically equal damage. Insurance Journal summarized a key nuance that I think every buyer should hear. First Street scores are described as estimating the exposure to a hazard. Not guaranteed damage, over a cumulative thirty year period. And whether exposure becomes damage can depend on nuances that First Street does not factor.
Structure specific details like foundation type, presence of a basement, first floor height, So you can have a home with high exposure score and still have zero damage in a given flood event. If the first floor is for example, elevated above the waterline. So this is not hair splitting.
what this is is secondary characteristics can make the difference between a scary label and an actual actionable insight for these disasters. Now here’s where it gets real. Right? When a buyer sees a score on a listing, they don’t treat it like a draft. They treat it like a warning label.
The Wall Street Journal described the market impact in practical terms. High climate disaster scores can deter buyers and complicate sales. And inaccuracies, when they happen, can be costly and difficult to unwind. this is why the fight isn’t just academic. In a normal consumer setting, a questionable score might be annoying.
In housing, it can change behavior very quickly, quickly enough to change price. So then Zillow pulled the scores. If the story ended with the platforms added risk scores, it would be straightforward. but actually the real story is what happened next. Zillow removed the numerical climate risk scores from direct display on the listing pages.
Multiple outlets reported that the change took place uh
, mid November twenty twenty five after pushback from the real estate industry. Especially the California Regional Multiple Listing Service, or CRMLS. Here’s Zillow’s own description of the change. The climate risk section still appears on the home details page. But instead of showing the numerical scores directly, Zillow links out to First Street’s website so shoppers can view the same property level information there.
Zillow also says FEMA flood zone information continues to appear directly on listings and that Shoppers can enable a climate risk layer in Map View. So the data didn’t disappear. The presentation has changed. The score moved another click away.
CRML’s criticism, quoted directly across multiple reports, was essentially that the display could be misleading. Especially when it showed near term probabilities that didn’t match local historical experience. The Verge reported comments from CRMLS CEO Art Carter, arguing that showing a probability of a specific home flooding this year or within five years can significantly affect perceived desirability. And that the MLS grew suspicious when it saw very high probabilities displayed in areas that hadn’t flooded in decades. Well, whether you agree with CRMLS or not, you can understand their leverage point.
Listings are fragile. Buyer attention is fragile. A single number can have enormous impact on a reframing a home instantly. And if the number is contested, the seller feels like they’re being penalized by a model they didn’t opt into. And they may not be able to audit.
So here is the hard truth. The models don’t always agree. now we get to the part that almost no consumer realizes Two different companies can look at the same location and come to two different conclusions about risk. Carbon Plan, a nonprofit research group has documented that climate risk vendors can produce meaningfully different estimates. Including differences in rankings that imply deeper disagreement, not just different labeling thresholds.
And in twenty twenty five, the GARP Risk Institute published a benchmarking study part of the UK’s Climate Financial Risk Forum outputs. Explicitly focused on how and why physical risk assessments differ across vendors at the asset level. They looked for how much variation you can see in the outputs. To say that in plain English, your house can be high risk in one model and not that risky in another because each model makes different assumptions using different data inputs and defines the thresholds differently. We aren’t saying that these models are useless, but it means that there are nuances and interpretations.
And for the average consumer, that’s a hard thing to grasp with a single number on a one to ten scale. What it means is that consumers should treat a single score like a starting point. Not a conclusion, but that’s not how the presentation on the real estate site is made. So why is this happening now? One reason the platforms try to surface this data is that it actually changes what people do.
There’s a very large real world experiment behind this. In a nationwide field experiment analyzed in an NBER working paper, Redfin randomly assigned seventeen point five million users to either see home specific flood risk information or not to see it. And then measured how behavior changed. Search, purchase decisions, and even pricing outcomes. So Redfin has publicly described this experiment It ran from October twelfth twenty twenty through January third twenty twenty one.
The treatment group saw flood factor data. The control group didn’t. And the flood risk was described as the risk of flooding at least once over the course of a thirty year mortgage. When you put risk in front of people early, some of them avoid it. Or demand a discount.
Which brings us to the uncomfortable part of the story for homeowners trying to sell their house. If risk becomes more visible, prices can change. And houses can take longer to sell. So here’s a question. Is this destroying home values?
Or is it correcting them? A version of this debate is simply, these scores are killing deals. But there’s a more subtle version too or perhaps one that matters more long term, which is were some homes previously overpriced because the actual risk wasn’t fully priced in? There’s academic work suggesting that flood risk hasn’t always been fully reflected in the prices. A well cited paper by Hino, Burke and colleagues estimated the millions of floodplain homes in the US were overvalued in aggregate.
On the logic that markets were not fully pricing flood risk and that disclosure regimes influence how strongly flood risk shows up in the pricing. Now I’m not saying every high score is correct, I’m not saying that every low score is safe. I’m saying that once risk becomes legible, once it becomes a number that you can compare between one house and another, markets tend to do what markets do. They price it. And that’s why this fight is so intense.
Because it’s not just about information, it’s about wealth. It’s about equity in the literal financial sense. A further consideration.
Climate change has altered the behavior of flooding. The fact that a house has not had a flooding event in the last thirty years is a factor. Sure. But there are areas that never flooded before that will. Fact.
So it’s a consideration that this is a moving target. Here’s my take, hopefully practical take. If you see a high flood score on a listing, this is not a prophecy, and you should not treat it as a prophecy. Treat it as a trigger for more work.
It means more due diligence in research, that what the high score might mean. First, confirm what the score measures. If it’s a thirty year cumulative risk score, don’t let your brain translate that into this will happen next year. Ask, over what horizon? Which flood types?
What are the assumptions here? Second, you should triangulate. Check at least one independent source. Zillow says FEMA flood zone information remains on listings, and you can use that as one input. But remember, FEMA maps and private models can differ, and different tools may tell different stories.
Even older FEMA maps differ from the new ones. A third point, structure matters. The property matters. basement, local topography, all of the details of the site itself can be the difference between exposure and real damage. Even if an area might flood.
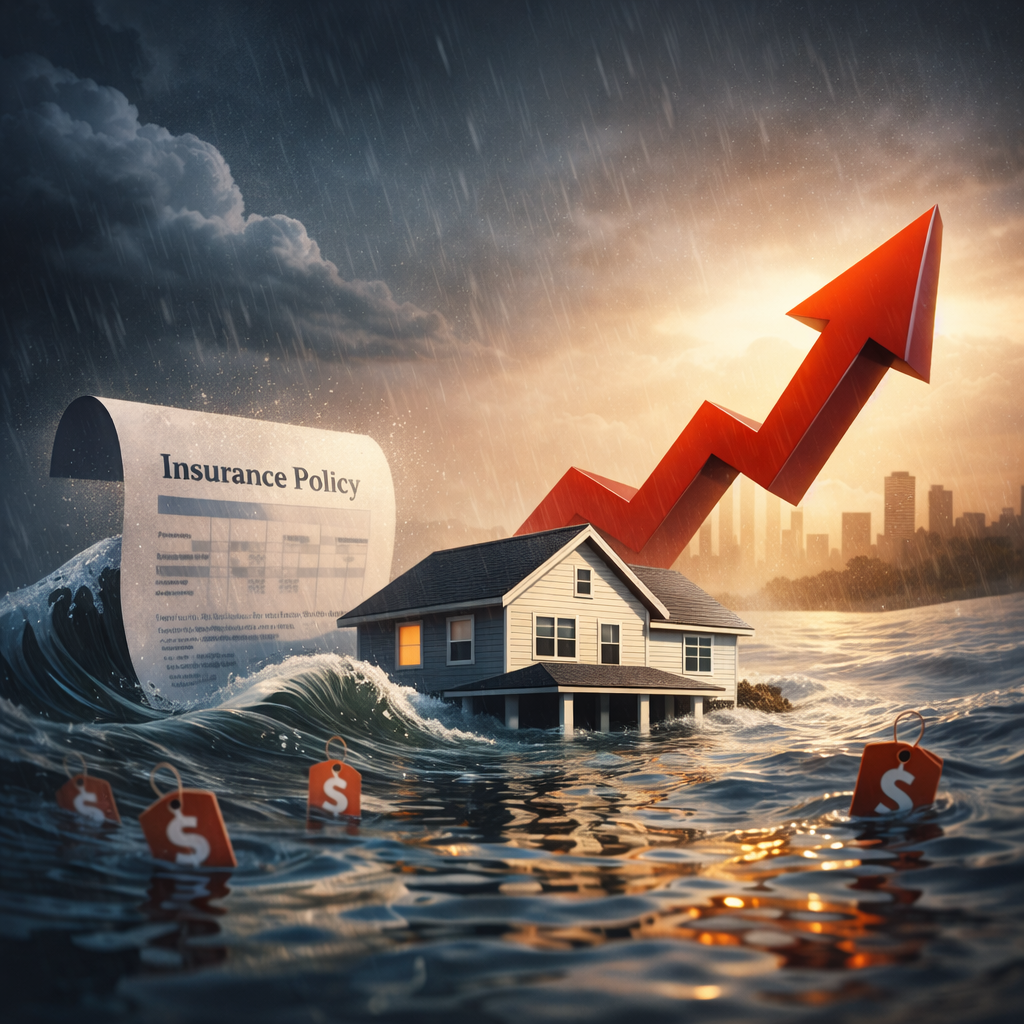
Fourth, what this forces you to do is pull insurance forward in the process. to an upfront consideration. Don’t wait until after you close on a house to discover affordability or availability constraints for insurance. In many places, insurance is an enormous factor, in where climate risk becomes financially real in a day to day way. If you want to see the most concrete way climate risk turns into a price, something more durable than a single number on a listing tab, look at insurance.
Because the score on the screen that we’re talking about might be new. But the insurance bill is already doing the job of pricing risk into housing month after month. In January twenty twenty five, the US Department of Treasury looked at homeowners insurance and found that the average premiums per policy increased eight point seven percent from two thousand eighteen To twenty twenty two. And in the ZIP codes with the highest expected losses from climate related perils, claims were not only more frequent, they were larger.
the Brookings Institute has summarized the same basic picture. Insurance costs are rising nationally, but the increase is not evenly distributed. People in the highest risk ZIP codes are paying substantially more than people in the low risk ZIP codes. now here’s where this hits housing values in a way everyone can understand. insurance isn’t optional when you have a mortgage.
The Consumer Financial Protection Bureau puts it plainly. Lenders for a mortgage require proof of homeowners insurance because they want the property protecting the loan to be insured. So if the insurance quote comes back way higher than expected, it can function Like a surprise second mortgage. And if you can’t get coverage at all, it can actually block the closing.
Floods make this even sharper because standard homeowners insurance typically doesn’t cover flood damage. FEMA says it directly. Most homeowners insurance does not cover flood damage. And flood insurance is a separate policy. And the CFPB notes that flood insurance is typically extra and that if you’re buying in an area, FEMA has designated as a special flood hazard area with a mortgage, you generally have to have flood insurance.
Then there’s the federal flood program itself. National Flood Insurance Program. An overhaul FEMA began implementing in twenty twenty one and says it fully implemented by April first twenty twenty three. whether that change raises or lowers a given house ‘s premium, the broader point is that the spread between lower risk and higher risk pricing gets harder to ignore over time.
So when people argue about a flood score on a listing, whether it’s fair, whether it’s accurate, whether it’s killing deals, I think the deeper issue is this. Even if the platforms hide the number, the insurance market is still sending a critical price signal. Remember that the score itself, whether you agree with it or not, the score doesn’t create the risk. The score makes the signal visible earlier in the shopping process. And that can pull future pricing into today’s negotiation.
So what should a seller do if a score looks wrong? If you’re the seller and you see a score you believe is inaccurate, you can treat it like you’d treat an error on a credit report. You document and you escalate. Your response should be to focus on verifiable facts.
Gather elevation certificates, If you have them on your survey, you should document for record any mitigation work You Collect flood history documentation. If the score is tied to an address or a parcel mismatch, which does happen, push for correction through the vendor’s dispute process. And, also, this is the hardest part, prepare for the possibility that the score perhaps isn’t wrong. What the score is doing is just describing the risk in a way that market has previously ignored or wasn’t forced to confront before.
Zillow’s decision to remove climate risk scores from direct display and shift to a link out model tells you everything about where we are right now. The appetite for this information is real. The demand for clarity is also real. The market impact is real.
But we are still far away from universal standards for how risk should be modeled. Explained, and disclosed at the specifics of the level of an individual home. So for now, buyers are left staring at a number. Sellers are left trying to defend their property against a model. Real estate platforms like Zillow are left trying to balance the fact that knowledge is power, the idea that a simple score can be misunderstood.
So that’s why this is the score that can sink a home sale. See you next time.